

Baseball Toaster was unplugged on February 4, 2009.
Ken: catfish AT zombia d.o.t. com
Ryan: rarmbrust AT gmail d.o.t. com
Philip: kingchimp AT alamedanet d.o.t net
For Joe Blanton over the past two years, it was the best of luck, and it was the worst of luck.
(The lame Dickens references end here. I promise.)
Many folks, including myself, wondered how Blanton, without really changing any of his peripheral numbers and rates, could manage to put up a 3.53 ERA in 2005, and a 4.82 ERA last year. Look at some of his rates:
| 2005 | 2006 | |
| ERA | 3.53 | 4.82 |
| WHIP | 1.21 | 1.54 |
| BB/9 | 3.00 | 2.69 |
| SO/9 | 5.17 | 4.96 |
| SO:BB | 1.73 | 1.84 |
| HR/9 | 1.03 | 0.79 |
His ERA and WHIP ballooned, but his walks per nine, strikeout-to-walk ratio, and home runs per nine actually improved. He gave up a lot more hits; that's obvious. But how, and why?
Let's start from the beginning.
In 2005, Joe Blanton, after a brief rough stretch to open his career, put up some great numbers. Before May 30th of 2005, Blanton had a hellish ERA of 6.66, but from that date until the end of the season, he put up a 2.53 ERA.
It's worth noting that Blanton had a batting average on balls in play (BABIP) of .284 before that break point, but afterwards he had a significantly lower .230 BABIP. Major League average for BABIP is considered to be around .290-.300. BABIP is considered to be controlled in part by the batter, mostly by the fielders, and very little by the pitcher. Anything far off of .300 is seen to indicate luck, or lack thereof.
Kentucky Joe had the third lowest BABIP in the majors, among all pitchers with 100 innings or more.
| # | NAME | TEAM | BABIP |
| 1 | Roger Clemens | HOU | .248 |
| 2 | Barry Zito | OAK | .249 |
| 3 | Joe Blanton | OAK | .252 |
| 4 | Pedro Martinez | NYN | .253 |
| 5 | Rich Harden | OAK | .257 |
| 6 | Carlos Zambrano | CHN | .258 |
| 7 | Tim Wakefield | BOS | .261 |
| 8 | Bruce Chen | BAL | .262 |
| 9 | Jose Contreras | CHA | .263 |
| 10 | Kris Benson | NYN | .264 |
In my estimation, Blanton's low ERA is largely due to his very low BABIP during the majority of the season. He got lucky that not many balls were falling in, and it affected his ERA positively.
And then we come to 2006. Blanton's BABIP luck completely reversed itself, and everything fell in for a hit. He was buried under a .341 BABIP. It was so bad that Blanton actually finished the year with the 5th highest BABIP of any pitcher with 100+ innings to his name.
| # | NAME | TEAM | BABIP |
| 1 | Ryan Madson | PHI | .364 |
| 2 | Victor Santos | PIT | .362 |
| 3 | Byung-Hyun Kim | COL | .350 |
| 4 | Ben Sheets | MIL | .342 |
| 5 | Joe Blanton | OAK | .341 |
| 6 | Brian Moehler | FLO | .340 |
| 7 | Zach Duke | PIT | .336 |
| 8 | James Shields | TBA | .334 |
| 9 | Paul Maholm | PIT | .334 |
| 10 | Andy Pettitte | HOU | .333 |
Here's a look at Blanton's BABIP and ERA over the past two years. Both stats are plotted as a five-day rolling average, and ERA has been scaled down by ten-fold for comparison.
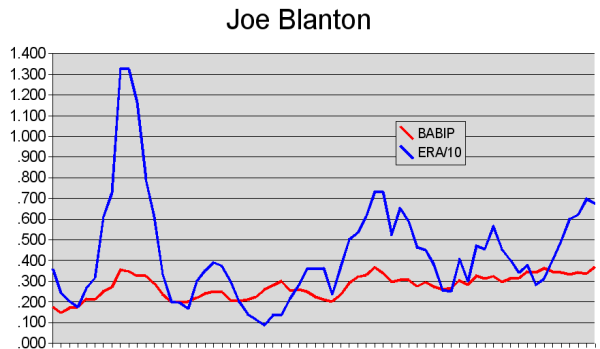
While not highly correlated, you can see that the BABIP variation coincided with his ERA exploding or collapsing, as it may have been.
An 89 point swing to one's BABIP is going to cause some pretty big ripples thoughout the rest of the stats. I'd be extremely surprised to see Blanton come near either .252 or .341 again.
So which version of Joe Blanton is the aberration here? The 2005 unhittable Blanton-ator, or 2006's jacked-around Joe?
Both are off, really. Blanton hasn't shown the ability to limit BABIP that a only a few pitchers seem to have. He's also not exceptionally hittable, as 2006 suggests he is.
Here are Blanton's career BABIP numbers. I've included the average BABIP at the level he was pitching for reference. And yes, NCAA BABIP is that high.
(Bold numbers are those that have enough innings to give an accurate number. Italics indicate small sample size)
| Year | Team | Level | IP | Lg BABIP | BABIP |
| 2000 | Kentucky | NCAA | 50 | .340 | .321 |
| 2001 | Kentucky | NCAA | 58 | .340 | .310 |
| 2002 | Kentucky | NCAA | 100 | .340 | .343 |
| Vancouver | A- | 14.1 | .327 | .282 | |
| Modesto | A+ | 6 | .323 | .368 | |
| 2003 | Kane County | A | 133 | .321 | .290 |
| Midland | AA | 35.2 | .318 | .206 | |
| 2004 | Sacramento | AAA | 176.1 | .322 | .326 |
As you can tell, Joe's never been that far off of the league average. So on the pure logic of regression to the mean, I certainly think Joe Blanton will have a good year in 2007.
Well, at least as far as BABIP goes. He's still got to figure out a way to strike out more than 5 batters per nine innings.
I think you mean Before May 30th. Interesting article, and I'm still very curious about how much a pitcher can influence BABIP. Do you have any insights, similar to those from your examination of Zito, that indicate whether his command or stuff was any different last year, leading to the rise in BABIP?
1. It's interesting to me that his BABIP goes up and stays up right around the all-star break. Which was right around when Bobby Crosby got hurt, and Marco Scutaro started to play every day. Scutaro, by David Pinto's measurements at baseballmusings.com, had the worst range of any shortstop in baseball last year. Perhaps Blanton's BABIP depends a lot on the shortstop. Just a guess...
2. I have suspicions that a good 12-to-6 curveball can affect BABIP. Zito, Duchscherer, and Blanton all have one, but of the three, Blanton's is the least effective. It's not as sharp-breaking, he doesn't control it as well, and he doesn't really set it up to be an out pitch. He's probably afraid to hang it and get hurt by a home run. I think there's room for improvement with it, and I suspect that if he gets into a good groove with it, throwing it when and where he wants, he can have a nice run of lower BABIP AND more strikeouts.
2 I agree, I think that Scutaro may have had an effect on Blanton's BABIP. I'm not sure it's large enough to explain much more than 20% of the rise in BABIP, though. Just a guess.
Also, yes, a very good curve can help keep BABIP down. Blanton's is not a very good curve, just a bit above average. It might help his terrible K rate, though.
Comment status: comments have been closed. Baseball Toaster is now out of business.