

Baseball Toaster was unplugged on February 4, 2009.
Ken: catfish AT zombia d.o.t. com
Ryan: rarmbrust AT gmail d.o.t. com
Philip: kingchimp AT alamedanet d.o.t net
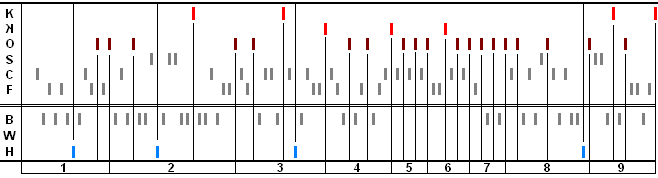
Straight from the Ryan Armbrust Graphical Baseball Laboratory, located in a secluded castle on a mountaintop of the Bohemian Alps in southeast Nebraska, I bring you my latest creation. What you see is every Oakland pitch thrown from one game last year.
What began as a simple experiment in visualizing pitch progression for a game ended up looking vaguely like a reject from the Frank Lloyd Wright school of stained glass windows.
Nonetheless, I think there's some promise to what I set out to accomplish. Let me go back to the beginning, and explain what I've got going on there.
On the left hand side, there are some letters that, while they may look like some kind of acronym from anatomy class in high school, are actually indicating the pitch type on the rest of the chart. K is a swinging strikeout, backwards K is a called strikeout, O is an out made on a ball in play, S is a swinging strike, C is a called strike, and F is a foul ball. Below the double line that marks good from bad, B is a ball, W is a walk, and H is a hit.
The vertical lines indicate the end of a plate appearance, and the numbers below everything help define the duration of a specific inning.
Bright red marks are strikeouts, maroon marks are outs on balls in play, and the blue dashes are hits. You can tell at a glance how many K's and hits a pitcher gave up over the course of a game. Speaking of which, I went the easy route for this first chart, and graphed one of the simplest games of 2006. If you can guess which complete game this was, and who the Oakland pitcher was who threw it, I'll consider the chart to be at least somewhat interpretable.
My goal here is to produce a sleek chart that will contain as much relevant info as possible. If you can take a glance at it and say, "Hey, I see that the second batter of the third inning saw a ball, took two called strikes, another ball, and then struck out swinging", that's what I'm aiming for.
There are some unresolved issues with it, such as how to deal with double plays (such as the one that ended the first inning), whether runs should be accounted for, pitching changes, and if I should differentiate between singles, doubles, etc. I've got some ideas brewing, though.
So, I'm going to open myself up to some criticism here. Keep in mind that I've only invested a couple hours into this prototype, but don't pull your punches. What, if anything, do you like about this? What would you include/exclude/change? Is it similar to an existing thing that I've managed to remain ignorant to? Also, let me know if you'd like to see more of this sort of nerdy numbers and pictures creation thing, or you'd rather I stick to more... traditional methods.
My first suggestion would be to move the "O" column to the top, so that all the different kinds of strikes are grouped together. It also makes it easy to compare BIP outs from BIP hits; they're on the opposite ends of the chart. (That would actually make the chart kind of cylindrical; it wraps around.)
Suggestion #2: it's pretty hard to tell where the innings begin and end. The line looks the same as any other PA. Maybe the innings can alternate background color or something.
Alternate colors would work well. I'm thinking of alterating two shades of one color for the SP, and then different colors for relievers.
Oh, and for those curious as to which game this was, it wasn't Haren or Blanton. It was the AL pitcher of the month in August 2006.
Also, where does this pitch-by-pitch data come from? Is there a free site to access this data during a season? Or even a pay site? I'm tossing around some nerdy studies myself, and am looking for easy data access. Thanks!
As for the pitch by pitch data, it's all courtesy of retrosheet, one of the greatest things ever invented. check out retrosheet.org
I also agree with more clearly demarcating the ends of innings; this in fact was the one thing that I didn't see right away. Another possibility is to use different shades of blue to indicate whether the hits are for extra bases, and you could do the same with the outs to represent double and triple plays.
Again, this is very cool.
http://www.baseball-reference.com/boxes/TOR/TOR200608230.shtml
Esteban Loaiza complete-game shutout on August 23.
- add a horizontal scale to see pitch progression (5, 10, 15, 20, etc.) - that way you can correlate pitch counts and the inning at a glance
- add totals to each row at the far left so you can see #K, #BB, #H, etc.
- the slash marks that denote each pitch could actually be a number or character that carries information. For example a double play could have a '2' instead of a slash. Triple play '3'. Infield Fly 'I'. Maybe this is off topic a bit but it's just an idea.
- Add groundout, flyout, and single, double, triple, HR marks. It's not that much more information and it allows you to compile just about every pitching stat from the chart
- more density is good, readers can generally handle far more information than is presented in common charts and graphs
I think you are off to a great start and it's always good to reexamine old ideas in new ways and I encourage you in your efforts. Nice work.
But it's a promising start to good idea.
And yes, this is the Loaiza complete game from last August.
I'm going to implement some of your suggestions, and I'll have a new version ready soon. I'll pick another game, and I'll try to make it a little more interesting.
Oh, and Padgett, thanks for mentioning Tufte. I strive to follow his theories when I can.
I meant 'far right'. Your eye follows the chart from left to right so it makes sense that the total would be at the end - on the right.
Comment status: comments have been closed. Baseball Toaster is now out of business.